Unlock the power
of your data.
Quantify is a hands-on analytics platform where SQL meets visualization and you transform raw numbers into strategic decisions. Built for career-switchers, analysts, and professionals who need data fluency before their next promotion.
What do you want to master?
Choose your analytics specialization.
report that data-driven decisions give them a competitive advantage.
Yet most professionals lack the skills to extract insights. The analysts, data scientists, and BI specialists who can turn raw numbers into strategy are the ones driving the next wave of business innovation.
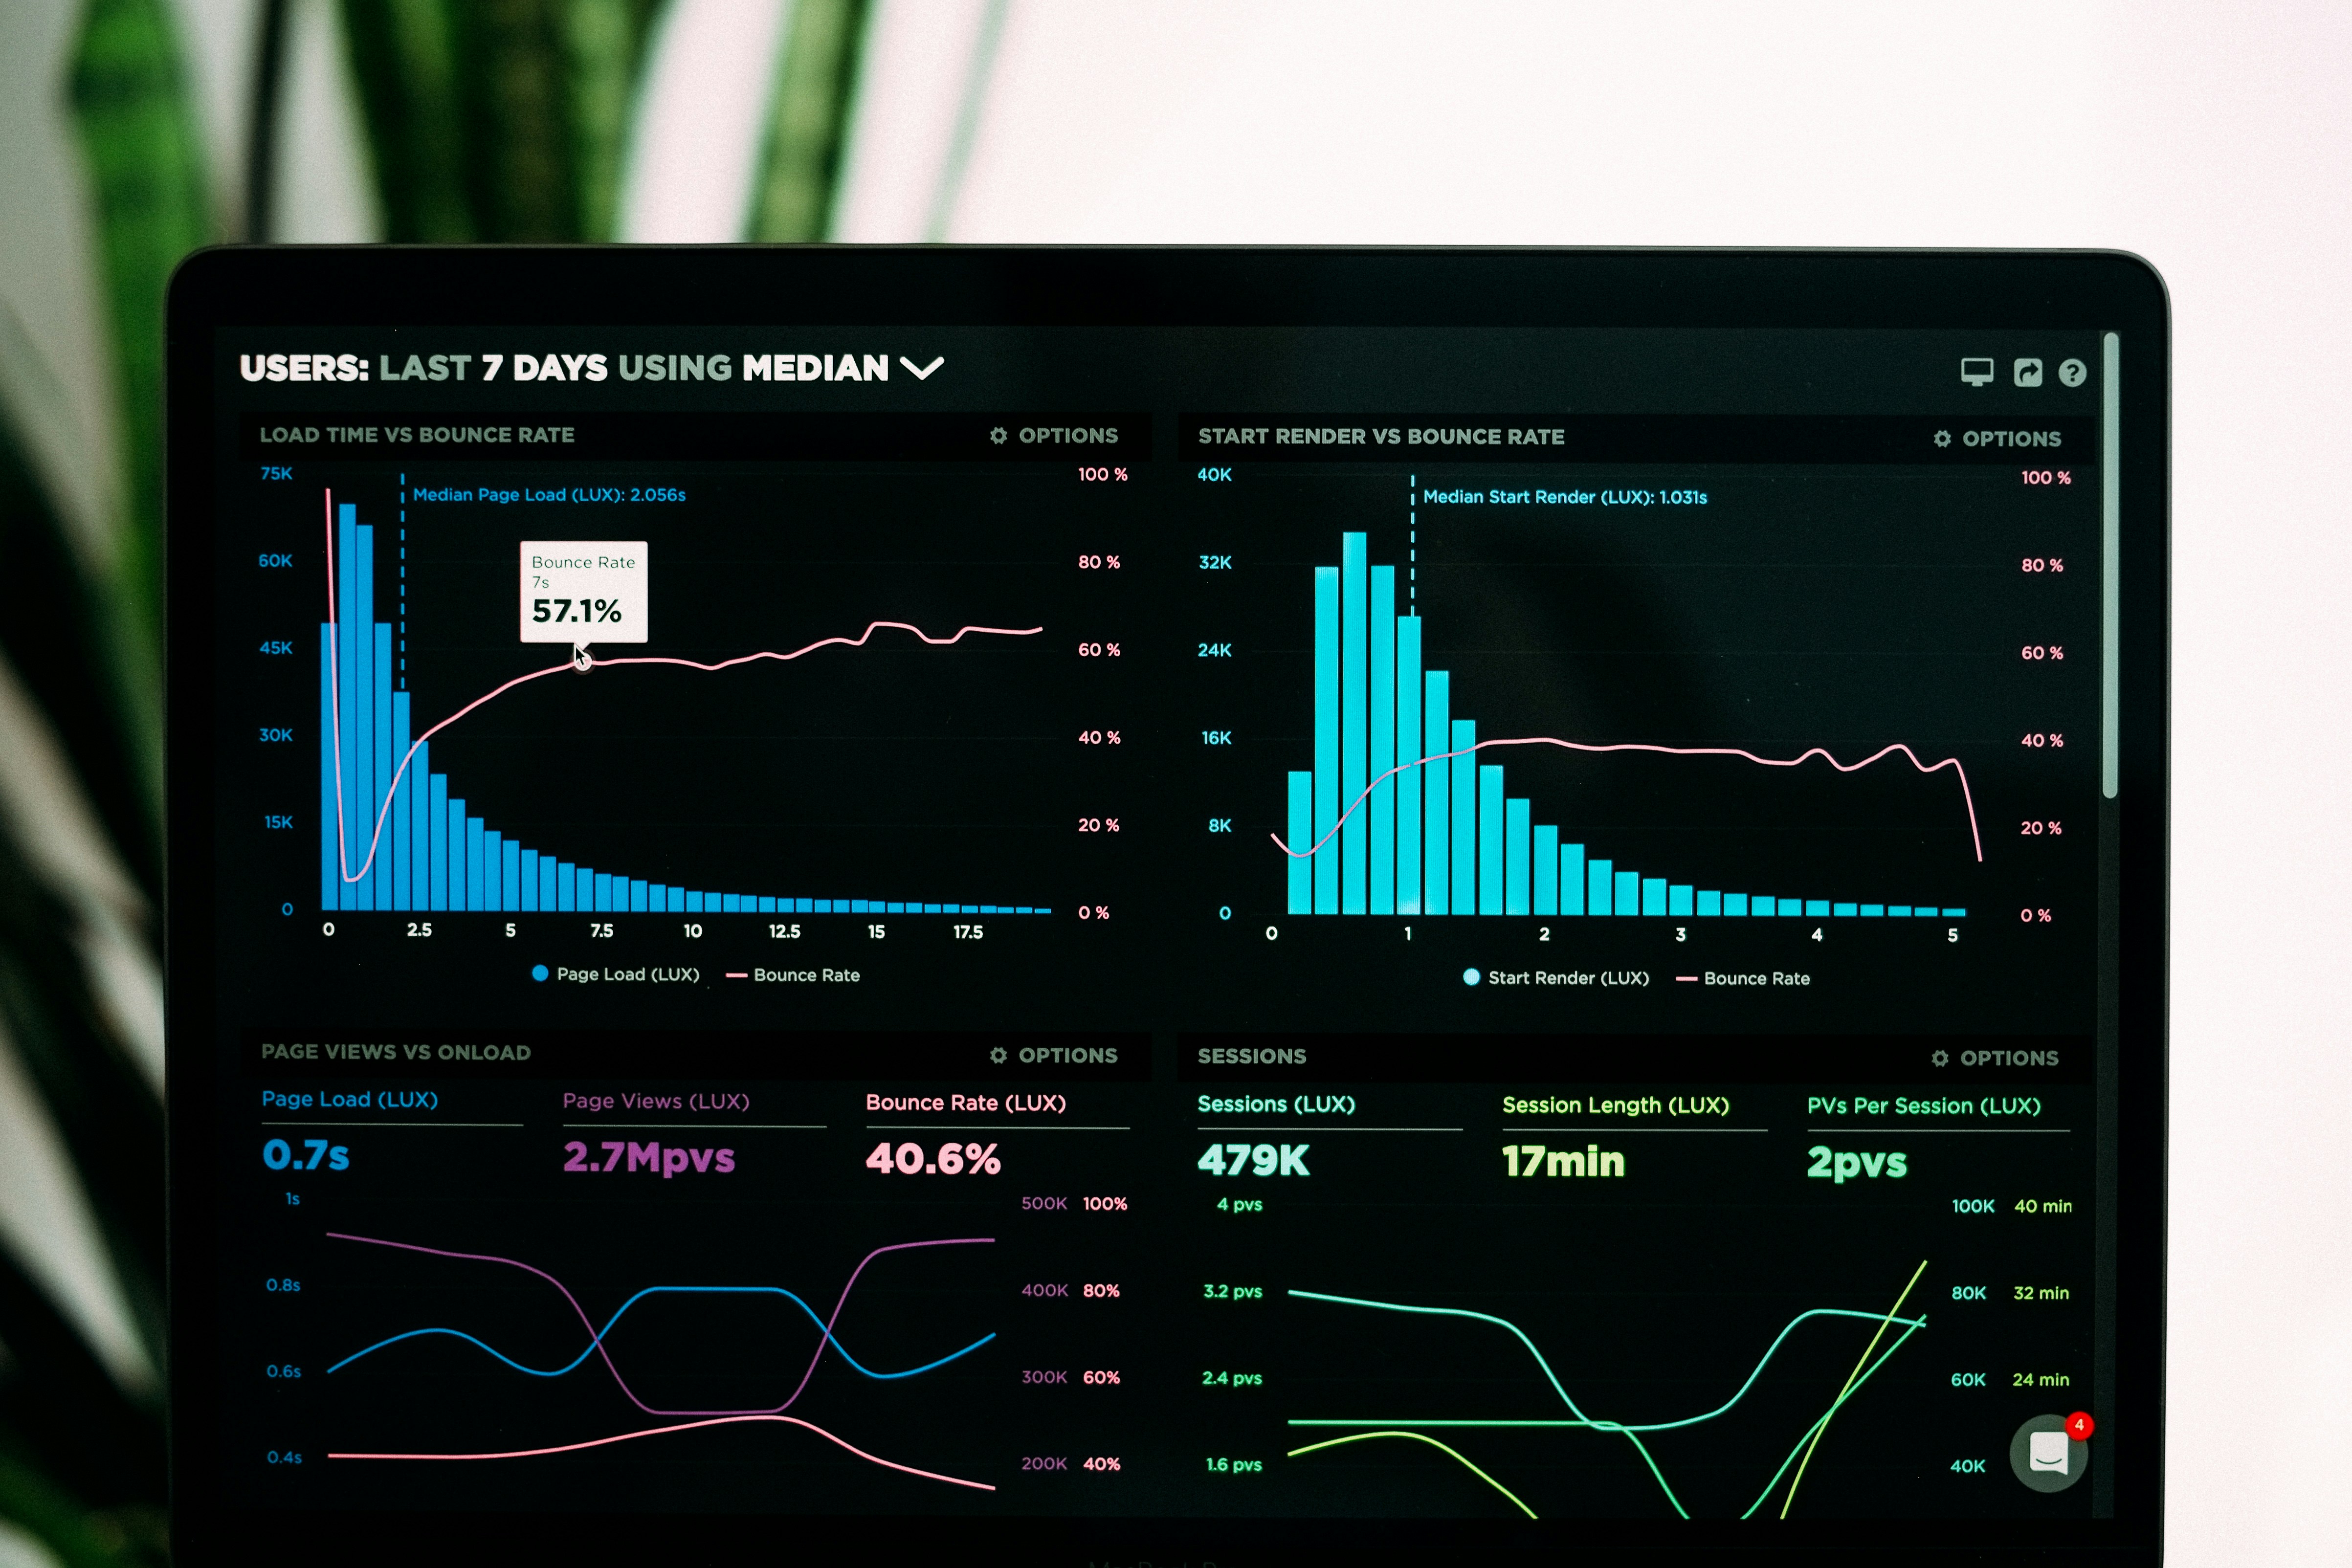
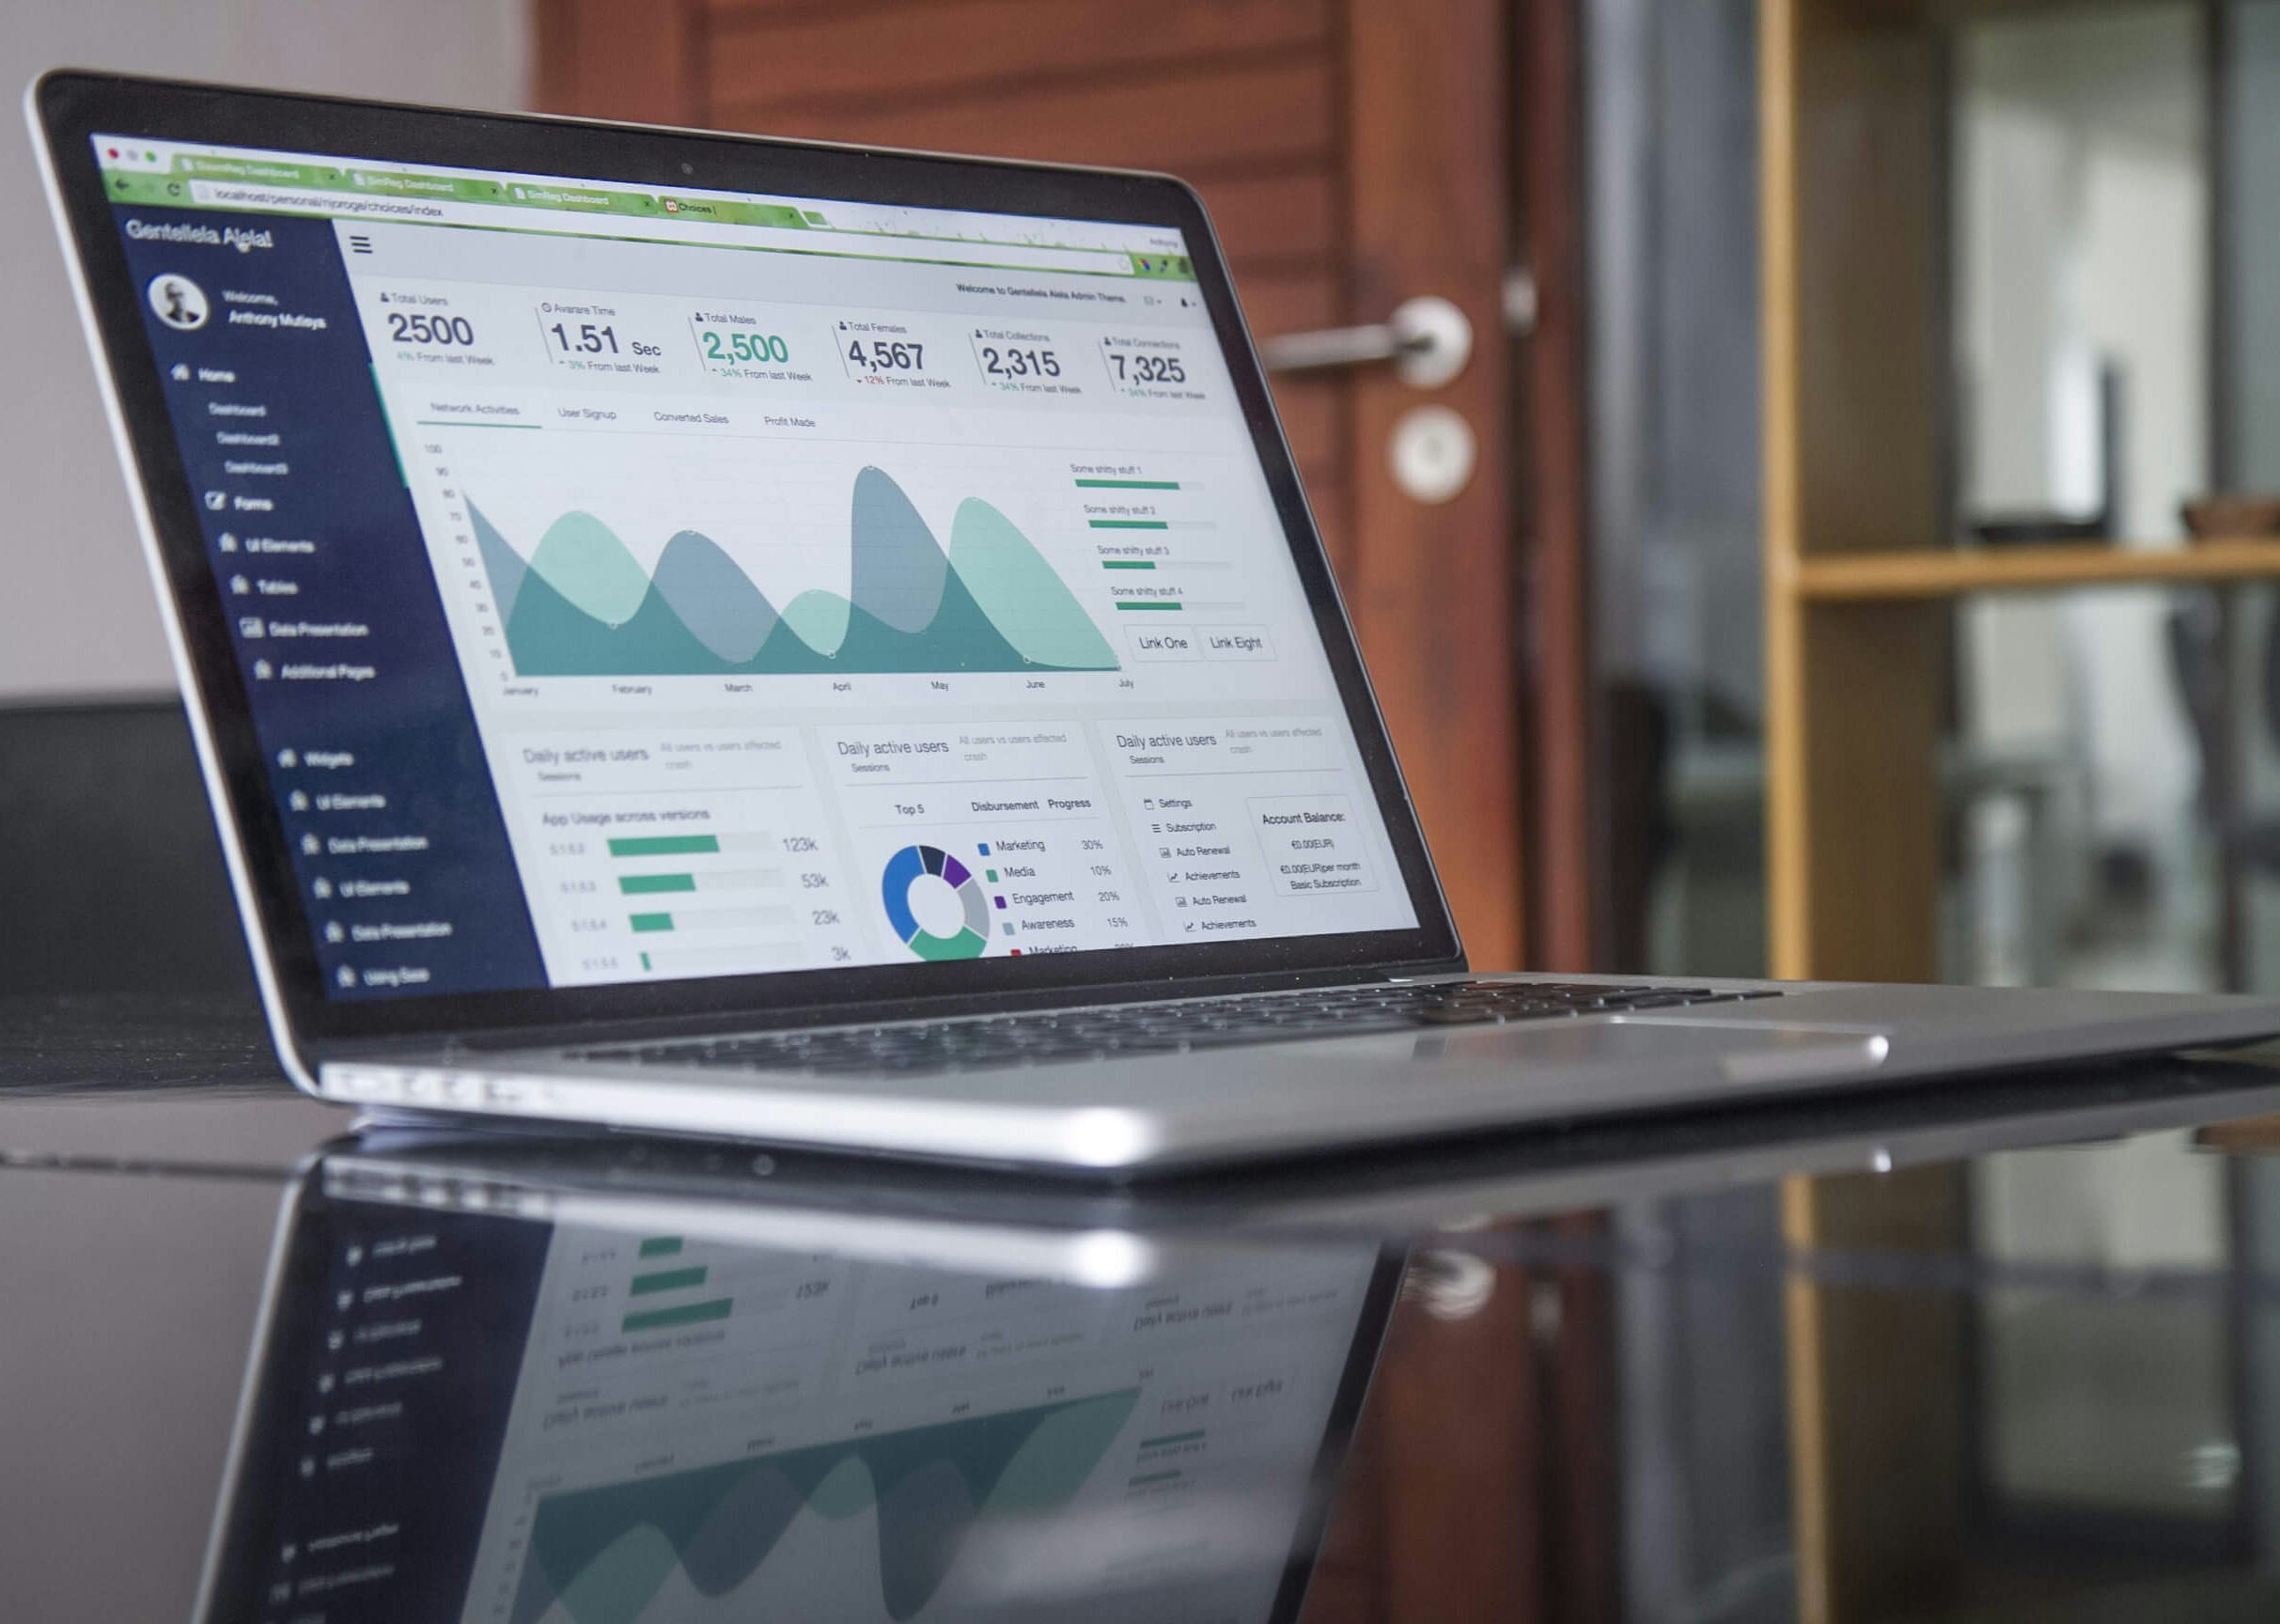
Watch your data transform into insights.
Drag the slider to advance through years of data maturity. This is what Quantify lessons look like — from spreadsheets to predictive models, see how organizations evolve.
Small dataset, basic spreadsheets. Manual reporting, no automation. Data exists but is not leveraged strategically.
Experts who've built
real data systems.
Every instructor has shipped production analytics. No academic theory without practice — only people who've scaled databases, optimized queries, and presented to boards.

Dr. Sarah Chen
Data Engineering
"Led data infrastructure at Netflix for 8 years, processing 2B+ events daily"

Marcus Williams
Business Intelligence
"Built analytics pipelines for 50+ Fortune 500 companies"

Dr. Elena Rodriguez
Predictive Analytics
"Published 30+ papers on machine learning applications in finance"

James Park
Data Visualization
"Tableau Zen Master with 500K+ community followers"
Real projects
real impact.
Customer Churn Prediction for a Telecom Provider
Could not write a basic SQL JOIN statement
Built a model with 87% accuracy, presented to executive team
Sales Performance Dashboard for Retail Chain
Struggled with Excel pivot tables
Deployed Tableau dashboard used by 200+ store managers

Inventory Optimization using SQL & Python
Marketing background, zero technical skills
Reduced stockouts by 34%, promoted to Operations Analyst

Jennifer Walsh
Senior Data Analyst
Airbnb · San Francisco
I joined Quantify as a marketing coordinator who couldn't read a CSV file. Twelve weeks later I was building predictive models and presenting insights to our VP. The hands-on projects didn't just teach me analytics — they made me think like a data scientist.
Begin Your Free
Analytics Week
7 days of full course access. One real-world dataset to analyze. No credit card. Just your email and a track.
- Full access to your chosen analytics track
- Interactive SQL playground & datasets
- Downloadable cheat sheets & templates
- Community of 12,400+ learners
No credit card · Cancel anytime
Join the Next
Live Demo
A free 45-minute session where our mentors walk through a real dataset analysis. Ask questions. See what learning looks like inside Quantify. Next session: April 15, 2026 · 2pm UTC